In the world of project management, meeting deadlines is a big deal. But projects can be unpredictable, and delays can happen. That’s where Schedule Risk Analysis (SRA) comes in.
In this article, I will explore how SRA can help prevent project delays, I’m not going alone; I have a trusty companion called Acumen Risk to guide me. Together, we’ll learn how to keep our projects on track and deliver them on time.
Delays in projects can cost a lot, harm your reputation, and disrupt your plans. But don’t worry, I have the tools I need. At the center of it all is Acumen Risk, a powerful tool to help me fight project delays.
So, if you’ve ever wondered how to protect your projects from unexpected setbacks, keep reading. I’m here to guide you through the world of Schedule Risk Analysis with Acumen Risk. By the end of it, you’ll be better prepared to prevent delays and make sure your projects stay on schedule.
Ready to get started? Let’s go!
The first thing I am going to address is schedule review to make sure that the schedule meets SRA requirements and schedule quality is high. The major steps in schedule analysis are:
Ensure the schedule reflects the project scope and execution strategy
Avoid open ends in the schedule logic, they compromise the schedule integrity
Minimize or remove date constraints
Eliminate out-of-sequence activities if the project is already in progress
Perform schedule benchmarking for major work packages to ensure the deterministic schedule aligns with the most likely duration
Conduct a critical path analysis
Conduct a Schedule review session involving relevant stakeholders from Engineering, Procurement, Construction, and Commissioning
Perform a schedule health check report with Acumen Fuse to ensure it meets high-quality standards and risk analysis requirements
Ribbon Analyzer
A ribbon analysis provides insights into how the chosen metrics differ among different activity groupings, making it a valuable tool for comparing these groups. Furthermore, each ribbon’s scorecard value offers a comprehensive summary of that particular grouping. In this case, the mentioned ribbon’s overall score is 88%, which demonstrates a high level of schedule quality.
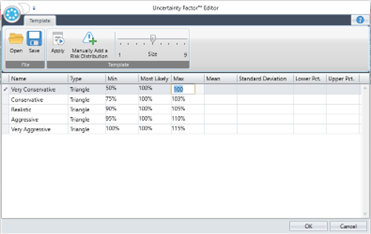
The second thing I am going to address is scenario one which is general uncertainty and getting that applied to the activities throughout the schedule. let’s consider an example using ‘Project ABC.’ Project ABC represents an offshore gas pipeline project, and I’ll use it to illustrate how I apply a 3-point distribution for duration uncertainty. In this example, I’ll focus on using a triangular distribution for all activities. I input duration uncertainties (only aggressive in this example) into the schedule within Acumen.
Uncertainty Factor
For example, the first analysis typically includes only the sources from duration uncertainty.
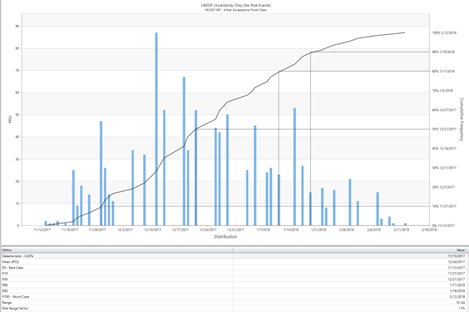
Risk Exposure Graph for Uncertainty Model
Then, a second analysis is conducted using both the duration uncertainty and discrete risk event sources. Risk inputs into the model can be performed using one or a combination of techniques (Uncertainty and Risk Factor).
Duration uncertainty ranging, and assigned discrete risk events, you have a complete model and can begin the analysis. Multiple ‘runs’ are conducted on the data, layering in the sources of risk exposure.
Risk Inputs and Activity Duration Ranges
Assess the activity duration ranges as three-point estimates: optimistic, likely, and pessimistic
Choose/ Determine appropriate probability distribution function
Identify & quantify the probability of occurrence and schedule impact range of those risks that have negative impact to schedule
Each analysis provides insights into risk exposure through distribution graphs and identifies the key risk drivers. Furthermore, it allows for a comparison of risk exposures across various analyses. The analysis process involves using a Monte Carlo technique to sample duration ranges, factoring in additive durations when risk events occur. It then leverages these durations to construct a potential critical path schedule, while adhering to the original schedule logic.
Typically, this analysis involves conducting 1,000 iterations. As a result, you’ll obtain 1,000 possible critical path schedules for the project. The earliest schedule includes activities at their minimum durations without considering risk events, whereas the latest schedule accounts for activities at their maximum durations along with the occurrence of risk events. The difference between these maximum and minimum dates represents the range of risk exposure.
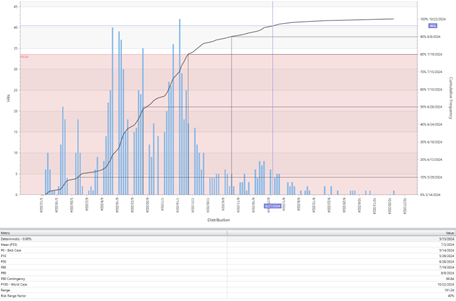
Risk Exposure Graph for Chemical Plant Project
For example, a P80 confidence level means that it is 80% likely that the mechanical completion will be achieved by July 19 or earlier. It is important for organizations to identify the desired P-value before the analysis process begins. Based on my experience, many companies incorporate a P80 contingency factor for both schedule and cost in their projects. This contingency is calculated as the time difference between the projected project completion date according to the deterministic schedule and the P80 date. Indeed, the inclusion of a P80 contingency factor can vary from one project to another and is often influenced by factors such as the client’s requirements and the complexity of the project. Consequently, project-specific considerations play a crucial role in determining whether and how to apply the desired P-value.
Another percentage shown on the risk exposure chart is the confidence level of achieving the project completion target. It’s worth mentioning that most schedules, even with modest risk modeling, have a <5% probability of being delivered on time. At times, individuals may mistakenly consider this as an indicator of the schedule’s quality; however, this is not accurate. A low probability means that there is so much uncertainty, so much undecided, and many external factors could affect the project, making it unlikely to finish by the scheduled end date.
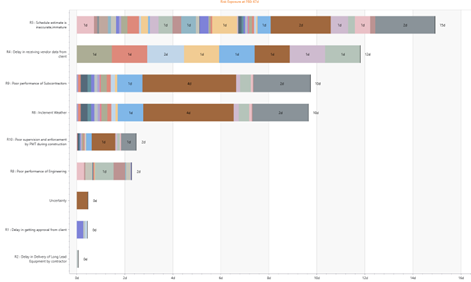
Now, let’s shift our focus to the risks that influence the project schedule, with the aim of mitigating delays. Acumen Risk, the same as Safran Risk and Risk Factor Module in Primavera Risk Analysis, offers a Risk Drivers chart, which provides a visual representation of schedule risk drivers in a tornado chart.
Risk Drivers Tornado Chart
For instance, let’s consider Risk No. 5 (inaccurate schedule estimate). This particular risk contributes to a 15-day delay out of a total delay of 67 days, as indicated by the risk exposure at the P80 level.
In conclusion, by identifying mitigation plans for the top risks on the tornado chart and implementing them during the execution phase, we can reduce the probability and mitigate the schedule impact of risks that might otherwise lead to project delays.